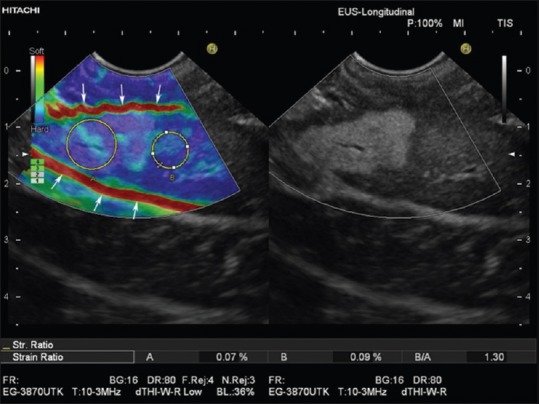
Figure 4.

Real-time tissue elastography with strain ratio measurement as applied to the liver. Region of interest A is placed within the hyperechoic liver mass and region of interest B in adjacent liver parenchyma. The Strain ratio of 1.3 indicates nearly equal elasticity of the lesion (which turned out to be focal fatty infiltration) and surrounding “normal” liver tissue. Due to respiration-induced movements, both slipping boundaries between liver and peritoneal space show a high strain (red lines, arrows) and should not be used as a reference area for strain ratio measurements
