Figure 5.

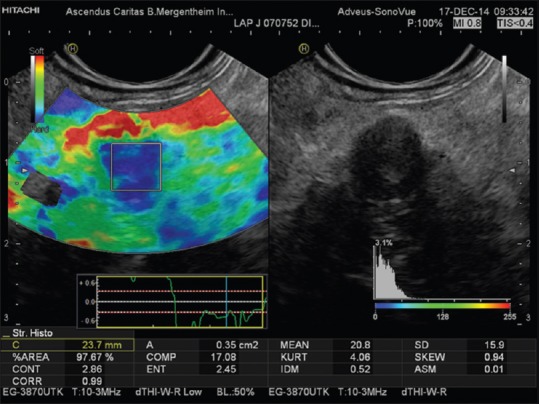
Histograms display the distribution of recorded strains (%) within an elastography region of interest of a small solid and malignant pancreatic tumor [same lesion as in Figure 3]

Histograms display the distribution of recorded strains (%) within an elastography region of interest of a small solid and malignant pancreatic tumor [same lesion as in Figure 3]