Figure 2.

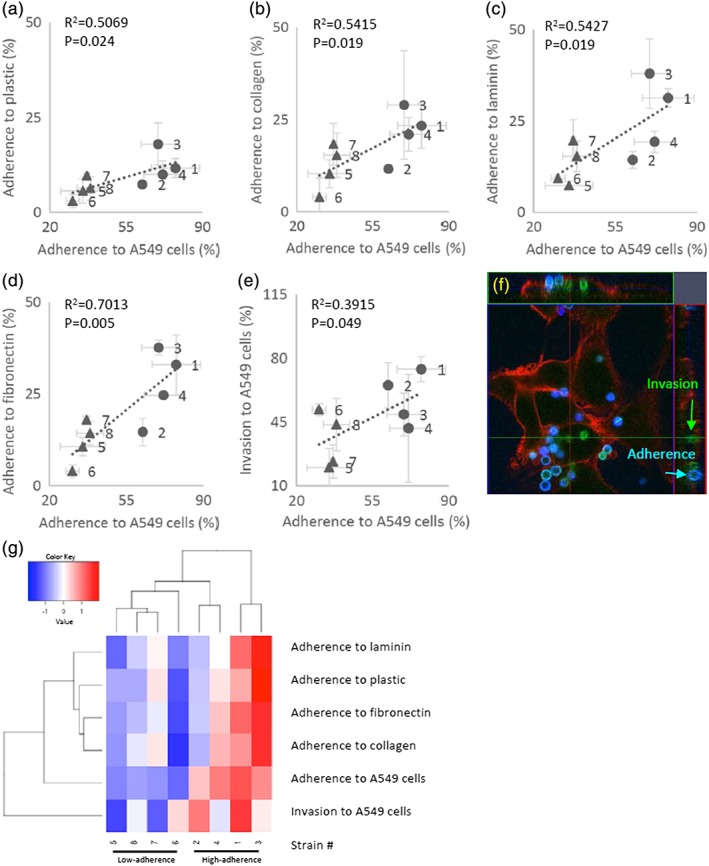
(a–d) Adhesion of Aspergillus fumigatus conidia to A549 cells (abscissa) versus extracellular matrices (ordinate), including collagen, fibronectin, and laminin, or uncoated‐plastic dishes in the high‐ (●) and low‐ (▲) adherence strains. (e) Invasion of conidia into A549 cells. Percent values are mean ± SD of three independent measurements. Regression lines, Spearman's non‐parametric rank correlation coefficients (R2), and p‐values (Student t‐test) are shown in each panel. (f) Green, conidia that invaded A549 cells at 5 hr after start of coincubation. Blue, conidia that adhered to A549 cells. Red, actin of A549 cells. (g) Heatmap of adherence to extracellular matrices and invasion data from the high‐adherence and low‐adherence strains. The heatmap was generated using the heatmap.2 function in the gplots package for the R programming language (R Core Team, 2014). The hierarchical clustering was conducted by Euclidian distance and complete linkage using variance scaling data
