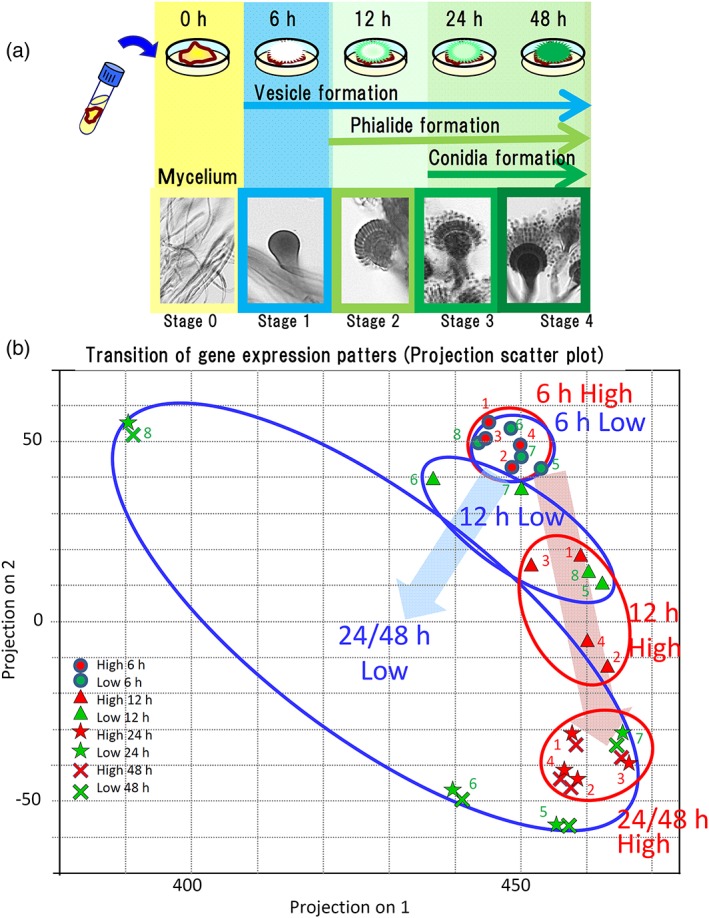
Figure 4.

(a; top) A schematic drawing of the stages of conidial production in Aspergillus fumigatus. Note that time scale is not linear in the abscissa. (bottom) Photographs of the fungi at the corresponding stages. RNA‐seq analysis was conducted at 0, 1, 2, 24, and 48 hr. (b) Transition of gene expression patterns in the high‐ (red filled symbols) and low‐ (green) adherence strains during conidial formation. The pattern was examined through principal component analysis. Strain number designations (see Section 2) are shown next to the corresponding symbols. The principal components for the high‐ and low‐adherence strains at each time point are denoted with red and blue circles, respectively. Values at 0 hr (mycelia) are not shown
