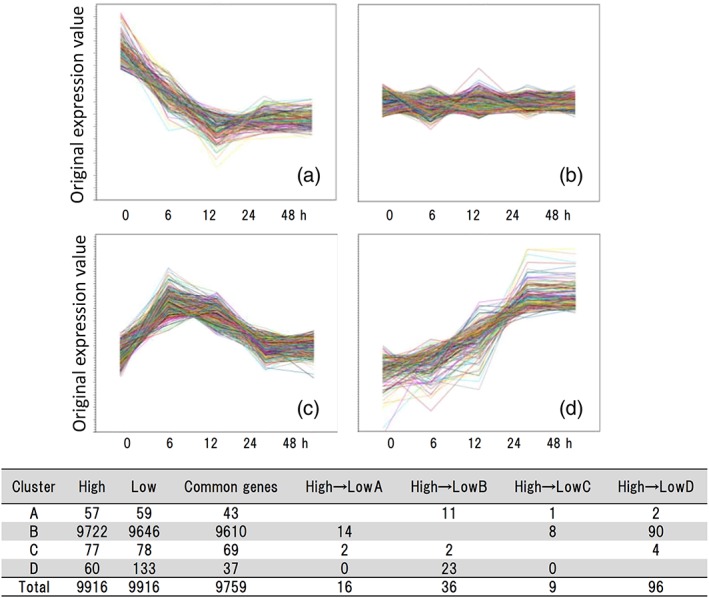
Figure 5.

Diagrams of K‐means cluster analysis of gene expression levels during conidial formation. Genes were classified into four categories, (A–D), depending on changes in expression patterns, as follows: (A) mainly expressed in mycelium; (B) no significant changes were observed during conidiation; (c) genes with enhanced expression during conidiophore formation; (D) genes with enhanced expression during conidial formation. In A–D, the ordinate is expression level, and the abscissa is culture period. The diagrams show data for a representative experiment. The results of the parallel analysis conducted for all the strains are not shown. Table: Number of genes assigned to each cluster. High: High‐adherence strains. Low: Low‐adherence strains. For instance, “‘High A” means “the number of genes assigned to Cluster A.” At Line A, “High → Low B” means the number of genes assigned to Cluster A in high‐adherence strains and assigned to Cluster B in low‐adherence strains. The number of genes that were assigned to Cluster A in high‐adherence strains and assigned to Cluster A in low‐adherence strains is shown as “common genes’”
