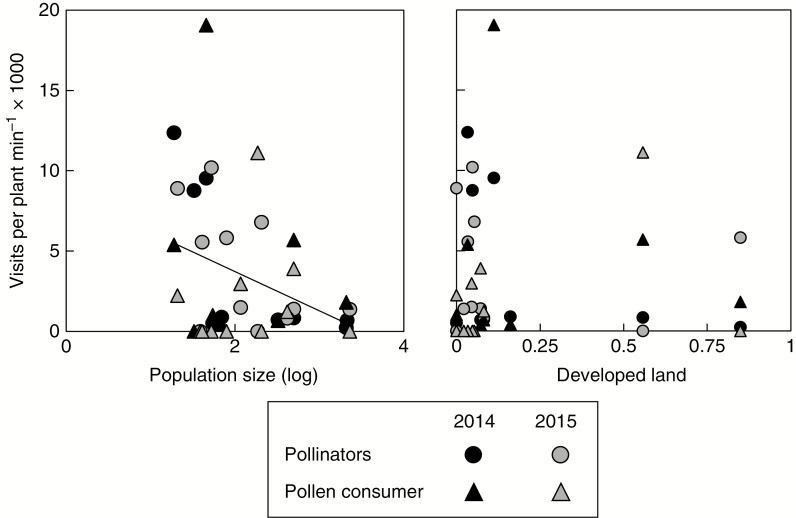
Fig. 4.
Scatterplots showing the influence of population size (log-transformed) and surrounding land use intensity (proportion of developed land surrounding populations) on rates of visitation by potential pollinators vs. beetles, a potential antagonist (pollen consumer). Visitation rate is shown by year and visitor type according to the key. A regression line based on average visitation across years and pollination types represents the significant influence of population size on visitation rate.

