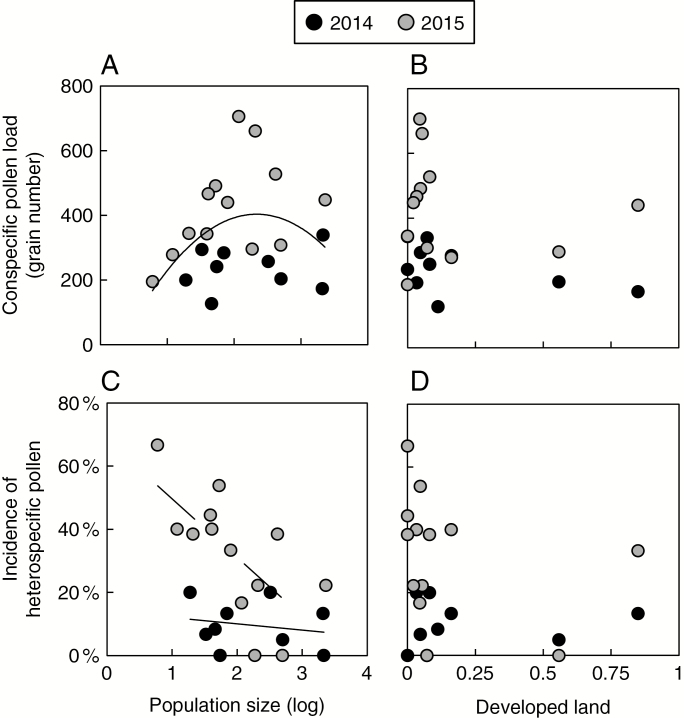
Fig. 5.
Scatterplots showing the influence of population size (left panel, log-transformed) and proportion of developed land surrounding each population (right panel) on stigmatic pollen loads. Top panel: mean conspecific stigmatic pollen loads per population in relation to (A) population size and (B) proportion of developed land. Bottom panel: incidence (percentage) of stigmas with heterospecific pollen per population in relation to (C) population size and (D) proportion of developed land. Regression lines are shown where significant. Data for the 2 years are differentiated as shown in the key.

