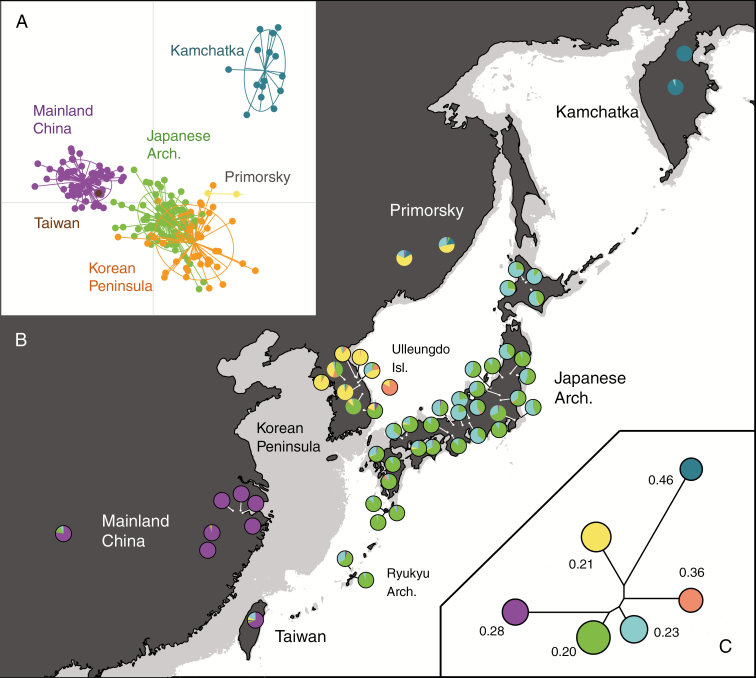
Fig. 3.
Genetic structure of East Asian Solidago virgaurea complex populations. (A) Individual plots of PCA and (B) population structure inferred by STRUCTURE analysis at K = 6 with the relationship between genetic clusters shown as a neighbour-joining (NJ) tree (C). In the NJ tree, the sizes of the circles represent the estimated heterozygosity in genetic clusters and the values indicate the FST values from the assumed ancestral genetic clusters. The geographic map represents the current land area (black) and the area during the last glacial maximum (grey), assuming sea level depression by 130 m.

