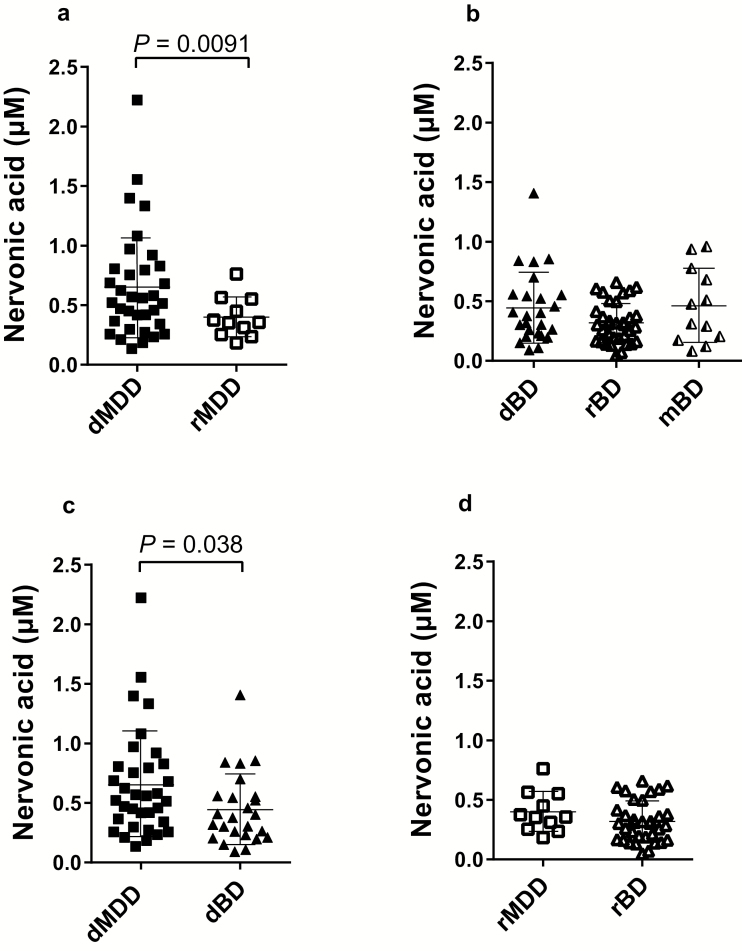
Figure 3.
State-dependent changes in plasma levels of nervonic acid in patients with MDD and BD in cohort 2. The bars indicate the mean for each group. The error bars represent the SDs. (a) Comparison between patients in the depressive state of major depressive disorder (dMDD) and the remitted state of major depressive disorder (rMDD) (Welch t test). (b) Comparison among patients in the depressive state of bipolar disorder (dBD), the remitted state of bipolar disorder (rBD), and the manic state of bipolar disorder (mBD) (1-way ANOVA with posthoc Tukey’s test). (c) Comparison between patients with dMDD and dBD (Welch t test). (d) Comparison between patients with rMDD and rBD (Welch t test).

