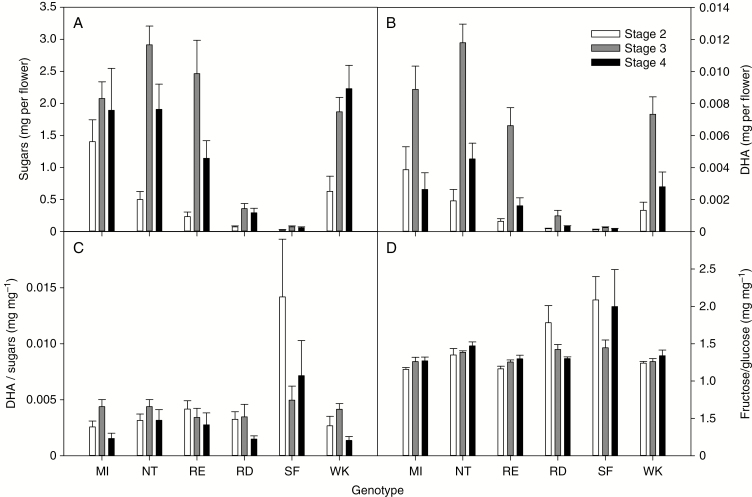
Fig. 4.
Nectar yield (total sugars per flower and DHA per flower) and composition (DHA to sugars and fructose to glucose ratios) for six genotypes of mānuka for floral stages 2–4. For genotype abbreviations refer to the legend for Fig. 2. Values are means ± s.e.

