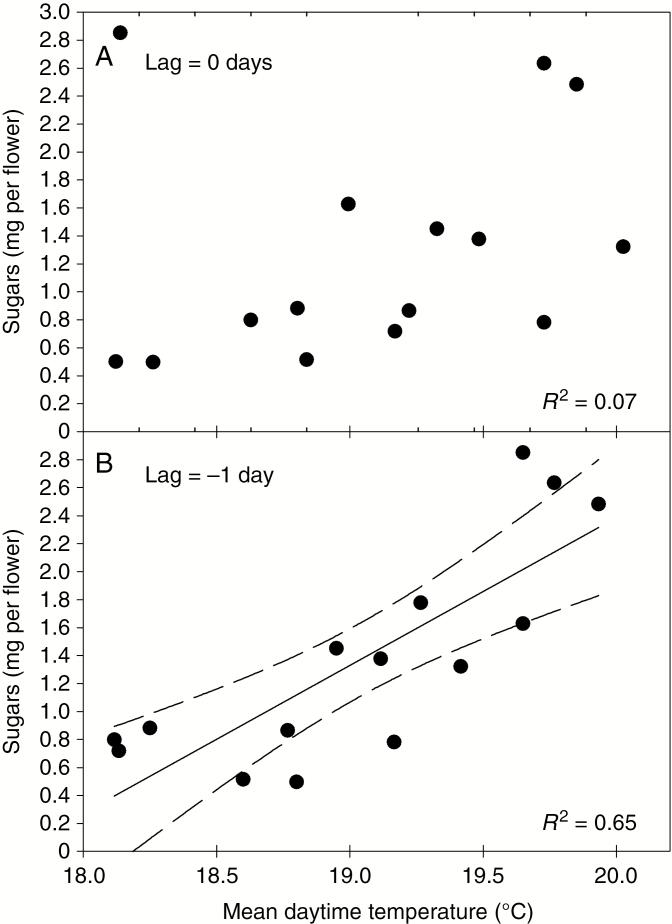
Fig. 7.
Relationship between average nectar yield per flower from Stage 3 flowers of mānuka genotype MI during the water stress experiment (both irrigation treatments), and daytime air temperature on the day of nectar collection (A), or daytime air temperature on the day before nectar collection (B).

