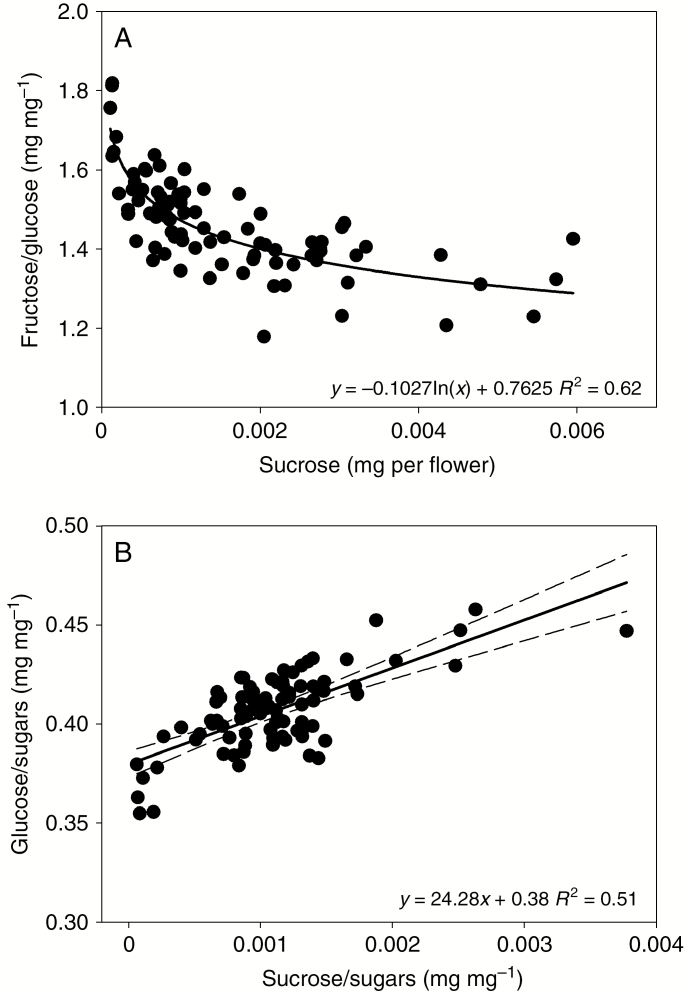
Fig. 8.
Relationships between glucose, fructose and sucrose content of nectar from Stage 3 flowers of mānuka genotype MI during the water stress experiment. (A) Fructose to glucose ratio as a function of sucrose content for the same samples. (B) Glucose to total sugar (glucose, fructose and sucrose) ratio as a function of the sucrose to total sugar ratio. Each point represents the pooled nectar from five flowers from the same plant.

