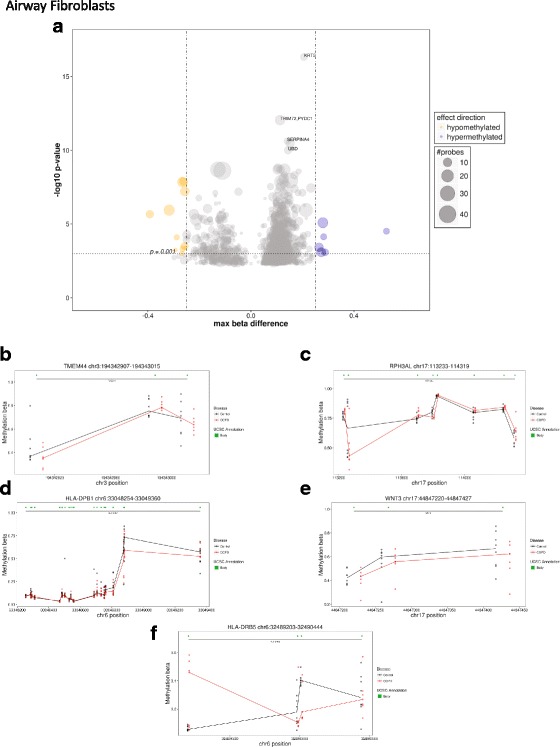
Fig. 1.

Regional DNA methylation differs in airway fibroblasts isolated from donors with COPD versus non-COPD. a Summary of regional DNA methylation differences between DNA isolated from donors with and without COPD. Circle size represents the number of probes per regions. Orange = hypomethylated in COPD samples, blue = hypermethylated in COPD. b–f Detailed plots of the five regions with the greatest maximum difference in DNA methylation between DNA isolated from donors with and without COPD
