Fig. 6.

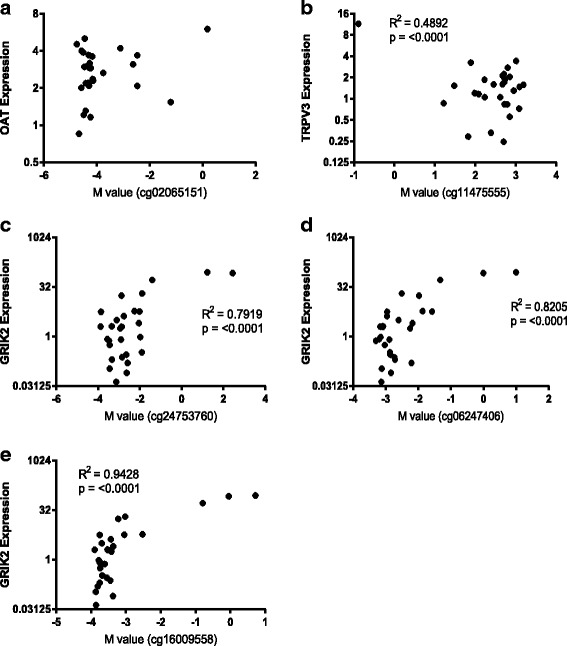
GRIK2 CpG site methylation correlates with gene expression. Correlations between gene expression levels and DNA methylation (here represented as M values, the log transformation of β values which are more statistically robust) for the three differentially variable CpG sites/genes. a OAT. b TRPV3. c–e GRIK2. R2 values and p values are shown within the plots
