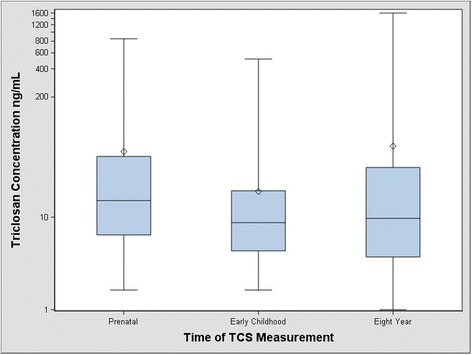
Fig. 1.

Urinary triclosan concentrations during three developmental periods among women and children from the HOME Studya,b. Whiskers represent the minimum and maximum, and the box edges represent the 25th and 75th percentiles, the line in the box is the median and the diamond is the arithmetic mean. The median prenatal triclosan concentrations are higher than triclosan concentrations during either early childhood or 8 years of age. aPrenatal triclosan concentrations derived from the mean of the 16-week and 26-week urinary triclosan concentrations. Early childhood triclosan concentrations derived from the mean of urinary triclosan concentrations taken annually from 1 to 5 years of age and eight year triclosan concentrations were taken concurrently at the time of adiposity measurement. All urinary triclosan concentrations are creatinine standardized. bThe minimum for all urinary triclosan concentrations was set to LOD/sqrt(2)
