Fig. 4.

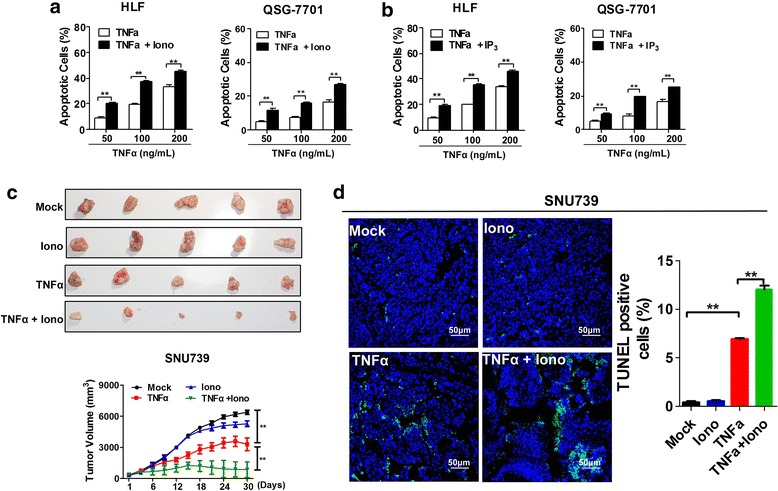
Cytosolic Ca2+ sensitized HCC cells to TNFα-induced apoptosis. Apoptosis analysis by flow cytometry 24 h after treatment of different concentration of TNFα with fixed ionomycin (1 μM) (a) or IP3 (10 μM) (b). c Tumor growth curves of subcutaneous xenograft tumor model developed from different oncotherapy strategies in SNU739 cells (Lower); dissected tumors (Upper) from sacrificed mice were shown (n = 5 for each group). Mock: 40% (wt/vol.) 2-hydroxyproplyl-β-cyclodextrin; TNFα: 40 μg/Kg;Iono: 3 mg/Kg Ionomycin; TNFα + Iono: 40 μg/Kg TNFα and 3 mg/Kg Ionomycin; (d) TUNEL staining in tumor tissues of nude mice xenograft model with treatment as indicated. Blue: DAPI; Green: TUNLE positive nucleus. Scale Bar, 50 μm. Data were shown as mean ± SD. All experiments were performed at least three times. * P < 0.05; ** P < 0.01
