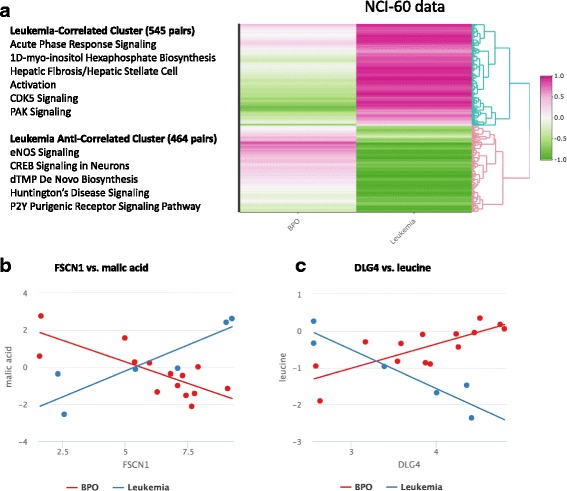
Fig. 2.

Results of IntLIM applied to NCI-60 data. a Clustering of Spearman correlations of 1009 identified gene-metabolite pairs (16,188 genes and 220 metabolites, 57 cell lines) (FDR adjusted p-value of interaction coefficient < 0.10 with Spearman correlation difference of > 0.5) in “BPO” and leukemia NCI-60 cell lines. Examples of two gene-metabolite associations with significant differences: (b) FSCN1 and malic acid (FDR adj. p-value = 0.082, BPO Spearman Correlation = − 0.75, Leukemia Spearman Correlation = 0.94), (c) DLG4 and leucine (FDR adj. p-value = 0.0399, BPO Spearman Correlation = 0.78, Leukemia Spearman Correlation = − 0.93)
