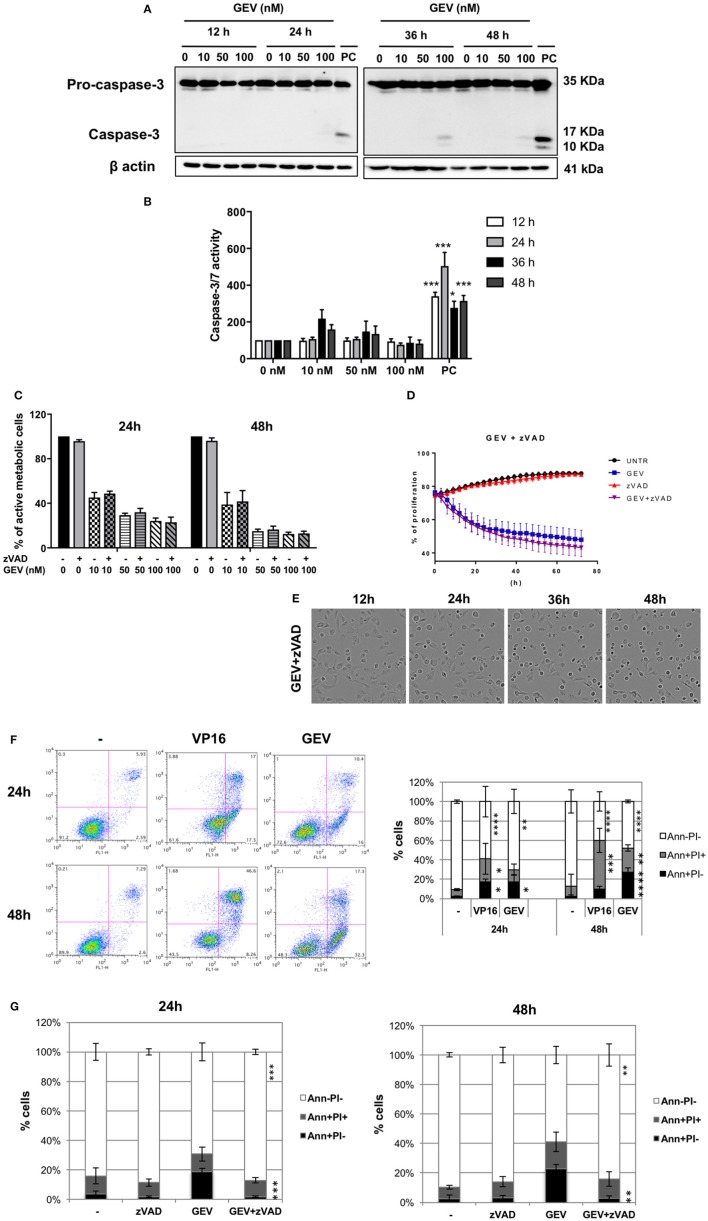
Figure 3.
Glucoevatromonoside induces cell death with hybrid characteristics. (A) A549 cells were treated with GEV, extracted proteins were separated by SDS-PAGE and analyzed by Western blot for caspase-3 cleavage. As a positive control (PC), U937 cells were treated with etoposide (50 nM VP16, 3 h); (B) Quantification of substrate cleavage using luminescence-based assays. Cells were incubated with GEV at 10, 50, and 100 nM and the activation of caspase-3 and−7 was investigated using a luminescence assay. Caspase activity was monitored after 12, 24, 36, and 48 h. As a positive control, A549 cells were treated with etoposide (50 μM VP16). Data were normalized to untreated controls; (C) Percentage of cells protected by z-VAD against a GEV-induced reduction of viability. (D) The proliferation of A549 cells after 72 h of GEV treatment with and without z-VAD (E) Representative bright filter images obtained with IncuCyte™ videomicroscopy of cells treated with GEV (50 nM) and z-VAD after 12, 24, 36, and 48 h. The data represent the mean ± SD of three independent experiments. *p < 0.05 (ANOVA followed by Dunnett's test) when compared to untreated controls. (F) A549 cells were treated with GEV (50 nM) and VP16 (50 μM) for 24 and 48 h, stained with annexin-V-FITC and PI and analyzed by flow cytometry. In each panel, the lower left quadrant shows cells negative for both annexin-V-FITC and PI (Ann-PI-), lower right quadrant shows annexin-V positive cells which are in the early stage of apoptosis (Ann+PI-), upper left quadrant shows PI positive cells, and the upper right quadrant shows both annexin V and PI positive (Ann+PI+) cells (G) Percentage of Ann+PI-, Ann+PI+, and Ann-PI- after 24 and 48 h of GEV treatment. Data shown represent the mean ± SD of three independent experiments [ANOVA-two way; Dunnett's (E) or Sidak (F) post-hoc analysis]. *P < 0.05, **P < 0.01, ***P < 0.001, ****P < 0.0001 compared to controls.

