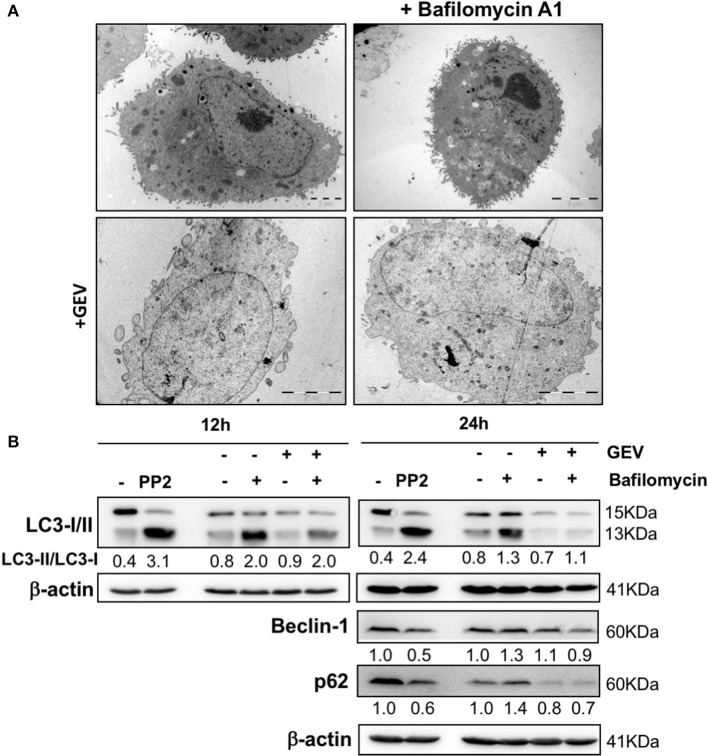
Figure 4.
Effect of glucoevatromonoside on autophagic flux. (A) Representative transmission electron microscopy of A549 cells treated with GEV (50 nM) with and without bafilomycin A1 (10 nM) after 12 and 24 h of treatment. (B) Western blot analysis of LC3-II, p62 and beclin-1 protein levels in A549 cells treated with GEV (50 nM) and bafilomycin A1. Mammalian Target of Rapamycin (mTOR) inhibitor PP242 (Torkinib) was used as a positive control. ™-actin was used as a loading control. The blots shown are representative of three independent experiments. Expression levels of proteins were quantified by using ImageJ software (National Institutes of Health, Bethesda, USA). Numbers below western blot signal represent quantification of LC3II/LC3-I proteins ratio using β-actin as control for sample input.

