Figure 6.
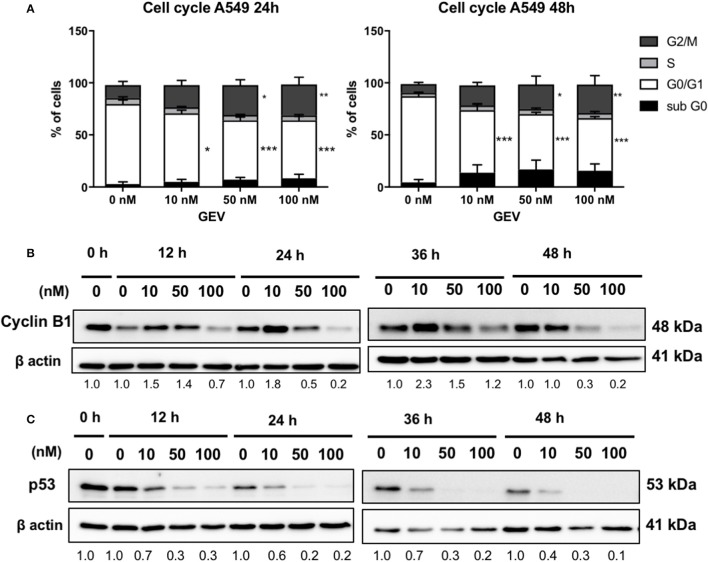
Glucoevatromonoside induces cell cycle arrest. (A) GEV causes accumulation of A549 cells in G2/M. Cell cycle analysis of cells treated with GEV for 24 and 48 h. Percentages of A549 cells in subG0, G0/G1, S, and G2/M are indicated. DMSO served as vehicle control. The data represent the mean ± SD of three independent experiments; *p < 0.05, **p < 0.01, and ***p < 0.001 (ANOVA followed by Dunnett's test) when compared to untreated controls; Western blot analysis of cyclin B1 (B) and p53 (C) expression in cells with and without GEV at 10, 50, and 100 nM, for 24 and 48 h. DMSO served as vehicle control. ®-actin was used as loading control. The blots shown are representative of three independent experiments. Expression levels of cyclin B1 and p53 were quantified by using ImageJ software (National Institutes of Health, Bethesda, USA). Values below western blots represent quantification of hybridization signals using β-actin for normalization. Significance is reported as: *P < 0.05, **P < 0.01, ***P < 0.001 compared to controls.

