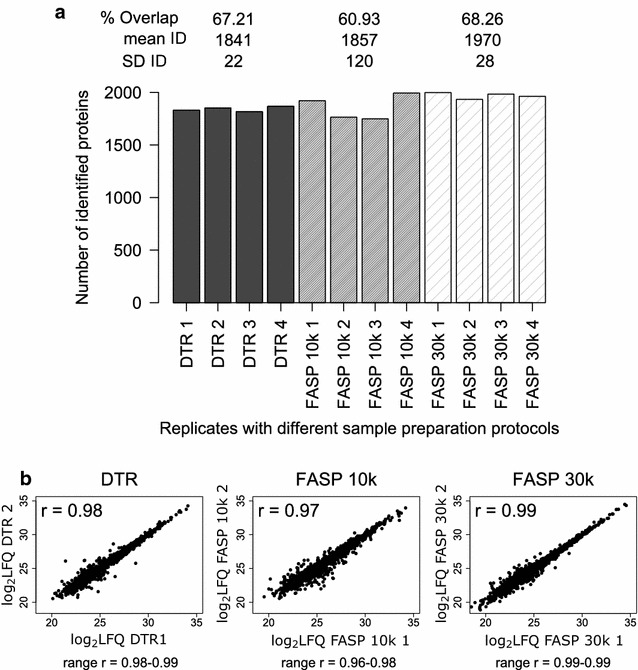
Fig. 2.

Qualitative and Quantitative reproducibility for the DTR and FASP protocol. a Numbers of identified Proteins (ID) for each replicate of the three protocols DTR (black), FASP 10 k (grey) and FASP 30 k (shaded). For each protocol, the mean and standard deviation (SD) of the ID as well as the proteome overlap were calculated. b Log2 transformed label-free quantitation values (LFQ) of the four replicates per protocol were plotted against each other and the Pearson correlation coefficient (r) was calculated. The plots and Pearson correlation coefficients of the first two replicates are shown while for the other correlations the range of the obtained coefficients were given for each protocol
