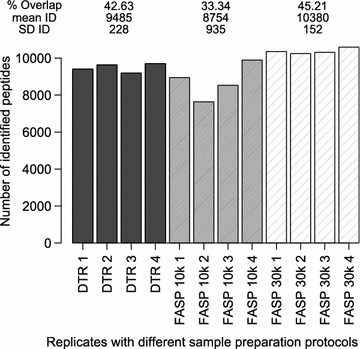
Fig. 3.

Peptide numbers and overlap in the four replicates. Numbers of identified peptides (ID) for each replicate of the three protocols DTR (black), FASP 10 k (grey) and FASP 30 k (shaded). For each protocol, the mean and standard deviation (SD) of the ID as well as the proteome overlap were calculated
