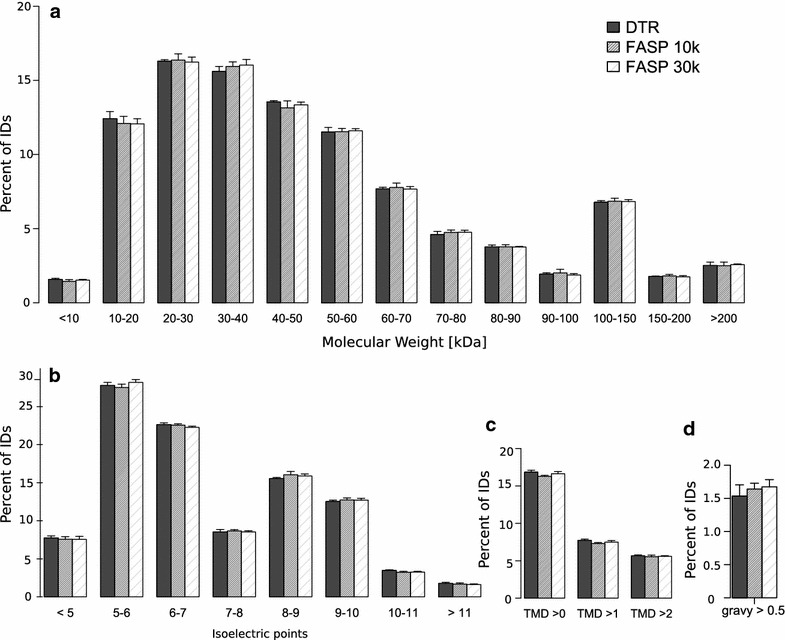
Fig. 6.

Physicochemical properties of the proteins identified with each protocol. Distribution of the Molecular weight (a) isoelectric point (b) gravy > 0.5 (c) and transmembrane domains (d) of the identified proteins. Mean and standard deviation of the four replicates for the DTR (black), FASP 10 k (grey) and FASP 30 k (shaded) are shown
