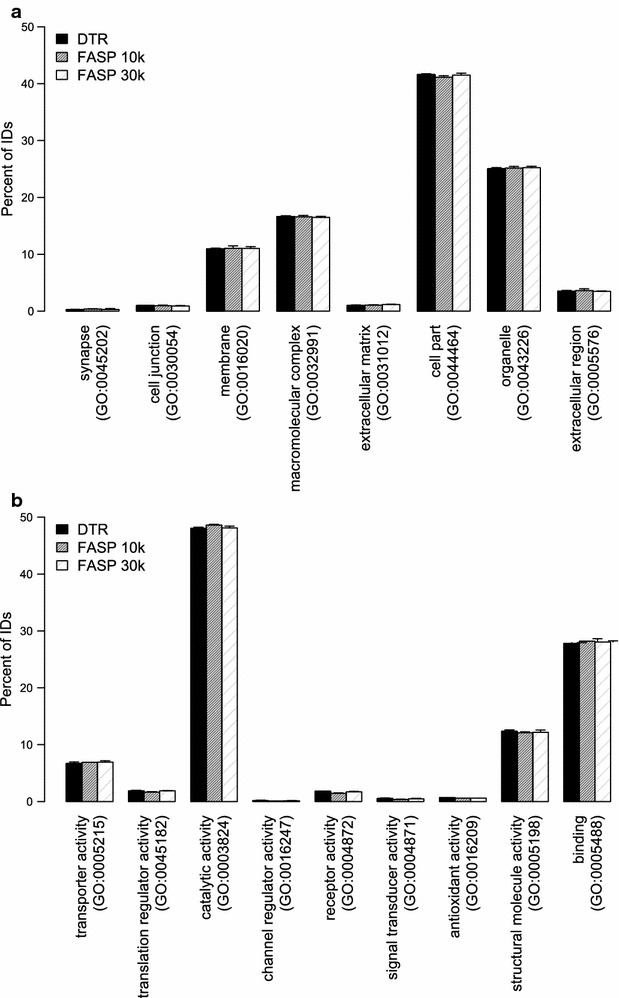
Fig. 7.

Distribution of gene ontology (GO) terms of identified proteins. Distribution of the identified proteins according to the cellular compartment (a) and to the molecular function (b) gene ontology terms. Mean and standard deviation of the four replicates for the DTR (black), FASP 10 k (grey) and FASP 30 k (shaded) are depicted
