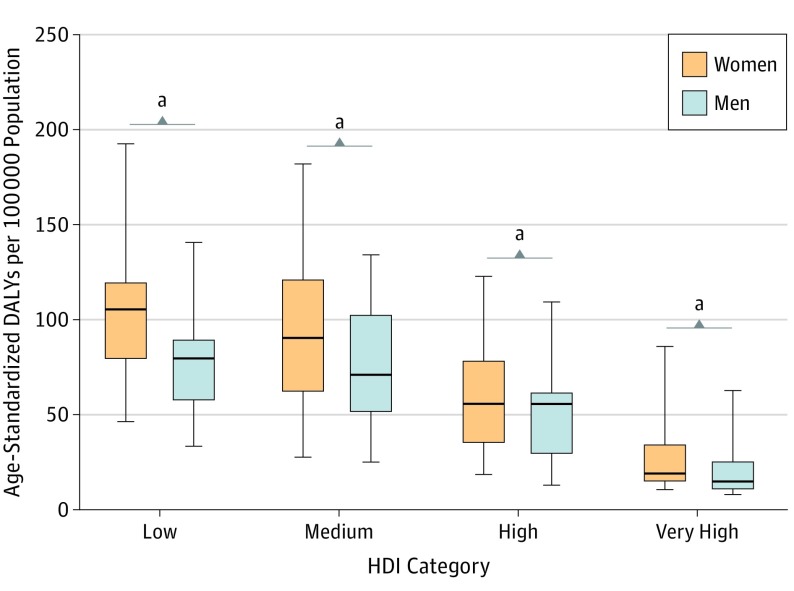
Figure 3. Sex Difference in Age-Standardized Disability-Adjusted Life-year (DALY) Rates.
Rates are stratified by human development index (HDI; range, 0-1.000, with higher values indicating higher levels of socioeconomic development) as an indicator of national socioeconomic status. Lines inside the boxes indicate the medians; boxes, the 25% and 75% percentiles; and lines outside the boxes, the minimum and the maximum values.
aFor difference between sexes, P < .001, paired Wilcoxon signed rank test.

