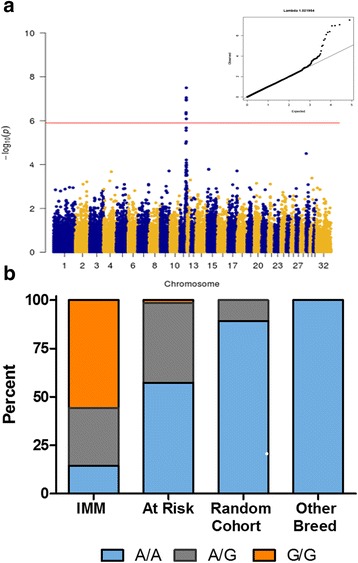
Fig. 2.

a Manhattan plot and (top right insert) QQ-plot demonstrating a genome-wide significant association with the IMM phenotype using GEMMA analysis [17] on chr11. Minimal genomic inflation was present. b Genotypes for the MYH1 E321G variant across IMM-affected horses (n = 71 GWA and follow-up cohorts combined), at risk horses (n = 75, housed on the same farms as IMM horses), a cohort of random QH (n = 28), and 21 other breeds (n = 179)
