
Fig. 1.
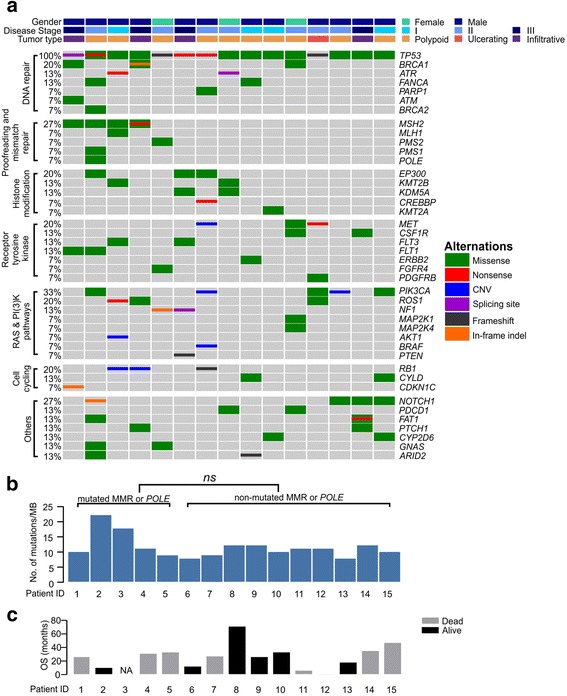
Mutation analysis of ESC patients. a A co-mutation plot of various types of mutations in all patients. Genes were grouped according to their functions. Each column represents one patient. The mutation rates of each gene were marked on the left in percentage and grouped according to their protein functions. Patient characteristics such as gender, disease stage and tumor type were shown at the top with different colors. b TMB in each patient. “ns”, not significant (Student’s t test, p < 0.05). c For overall survival (OS) time, black bars indicate that the patient was still alive at the time of last visit and grey bars indicate patients that were passed away. One patient was lost to follow-up and his OS time was marked as “NA”. All patients were placed in the same order in the 3 panels