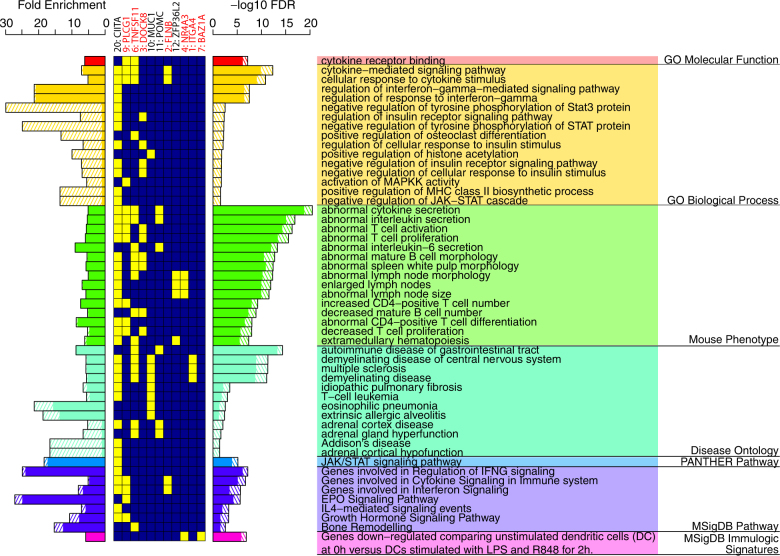
Fig. 3.
Gene function and pathway enrichment analysis for the replicated new IBD loci. Solid bars denote enrichments obtained from the recaptured known IBD loci. Bars in shaded lines denote additional enrichments due to inclusion of our replicated new loci. Enriched terms are ranked by FDR within each category, and only the top 15 most significant terms in each category are shown. Yellow and blue boxes in the center show the involvement (yellow boxes) of each locus in the enriched terms. Loci not enriched in any of the shown terms are removed. Best candidate genes implicated in the enriched terms for each locus (new loci or new signals at known loci), and the locus index, are shown on the top. New loci are marked by asteroid. MHC region (chr6:29–34 Mb) is removed from this analysis

