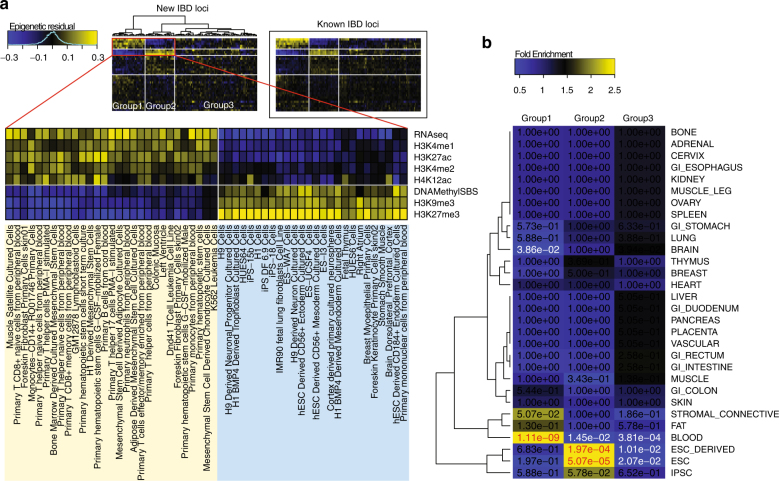
Fig. 4.
Enrichment pattern of epigenetic marks. Using 34 epigenetic marks in 127 epigenomes from RoadMap Epigenomics, we calculated mean signals (in log scale) of each mark in each cell type at our detected IBD lead SNPs. We adjusted for SNP density and subtracted mean signals of corresponding marks and cell types at all non-IBD SNPs (see Methods). We further removed mark effects and cell type effects to obtain residual signals. a Heatmap of the residual signals at the lead SNPs in the 22 novel IBD loci or new signals near known loci. We observed a clear enrichment pattern that separated the 127 epigenomes into three groups, with the first two groups and a subset of epigenetic marks showing in the zoomed view. Heatmap of the residual signals at known IBD loci is shown in the boxed area for comparison. b Fold enrichment of cell type anatomy in the three epigenome groups marked in (a), with fisher’s exact p-values for enrichment showing in the heatmap. Significant p-values for enrichment and depletion of cell type anatomy are shown in red and white colors, respectively

