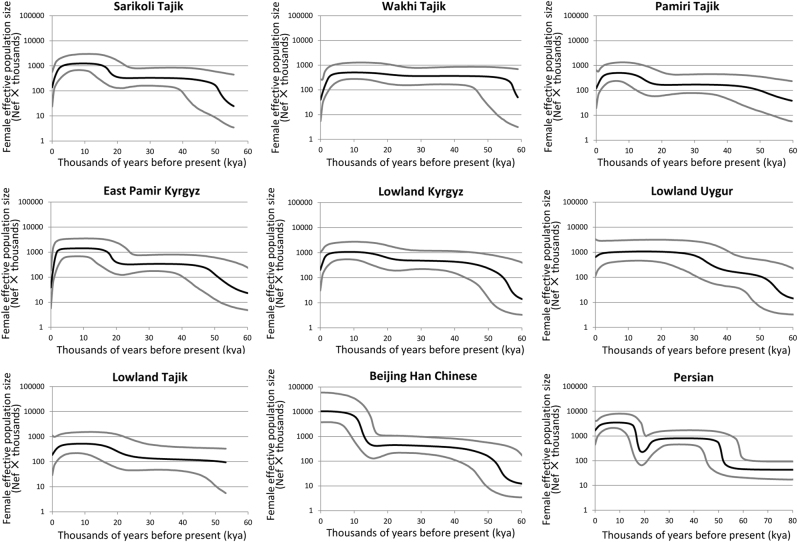
Fig. 4. BSP of female effective population size (Nef) through time for nine populations.
. The bold black line represents the median population size estimate from Bayesian posterior distribution. The gray lines delimit the 95% highest posterior density (HPD) boundaries, accounting for uncertainty in the reconstructed phylogeny and substitution model parameters. All the lines were drawn within the lower 95% HPD boundary of the maximum time to the coalescent age

