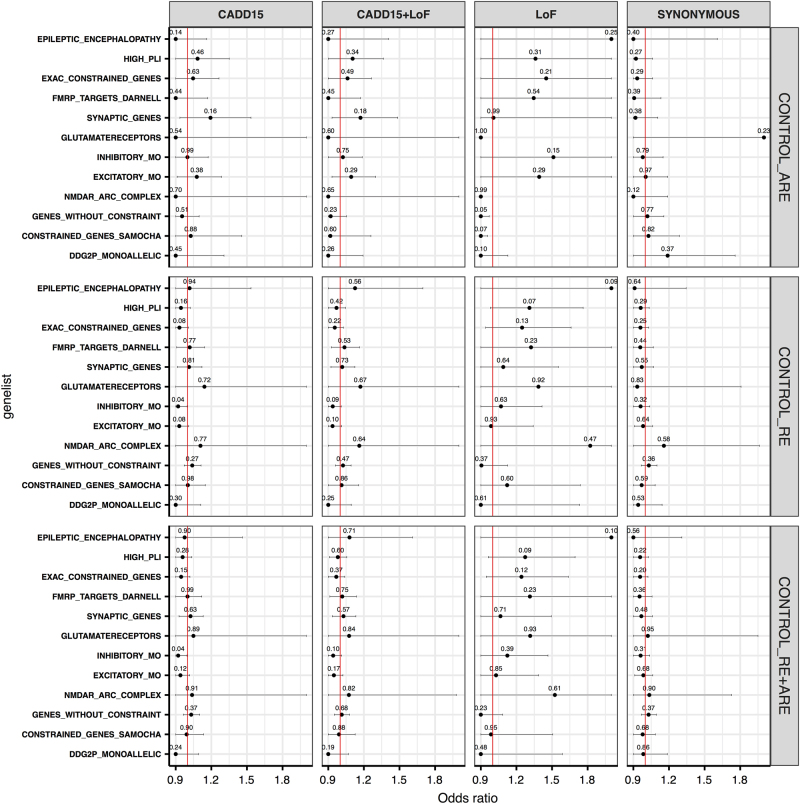
Fig. 2.
Gene-set burden across different variant classes. Each panel represent a different variant class. The synonymous variants serve as a control variant class. GRIN2A was removed from all gene-sets to identify other contributing genes. On the x axis, the odds ratios in cases vs controls are given. On the y axis, the names of different gene-sets are given. The red vertical line represents the expected odds ratio of 1. The horizontal lines indicate 95% confidence intervals and are restricted to the maximum of odds ratios over all gene-sets. In that case, points are represented as the points without error bars to their right. The uncorrected p-values are shown on top of each point. CADD15 = deleterious predicted missense variants. LOF = Loss-of-function variants (colour figure online)

