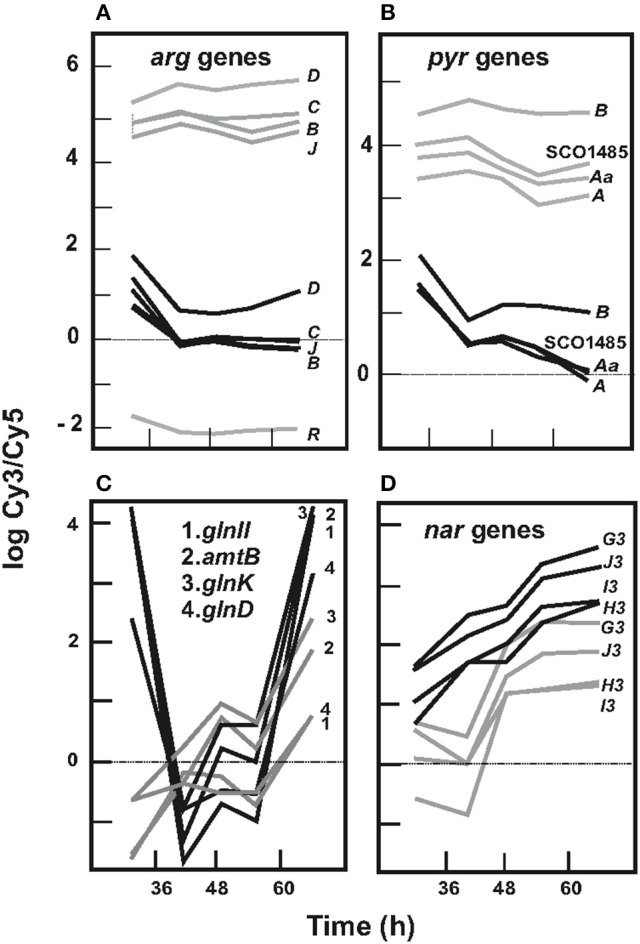
Figure 3.

Expression profile of different genes in S. coelicolor M145 and S. coelicolor ΔargR. (A) Arginine biosynthesis genes. Profiles of argB, argC, argD, argJ, and argR are shown. Mg values for argR probe in mutant strain correspond to a nonexistent argR gene, and, thus serve to assess Mg values reflecting lack of expression. (B) Pyrimidine biosynthesis genes. Only pyrAa, pyrA, pyrB, and SCO1485 are shown as a model. (C) Profile of glnII amtB, glnK, and glnD as model of nitrogen metabolism genes. (D) Expression profile of nar3 genes. S. coelicolor M145 genes (black lines) and S. coelicolor ΔargR genes (gray lines).
