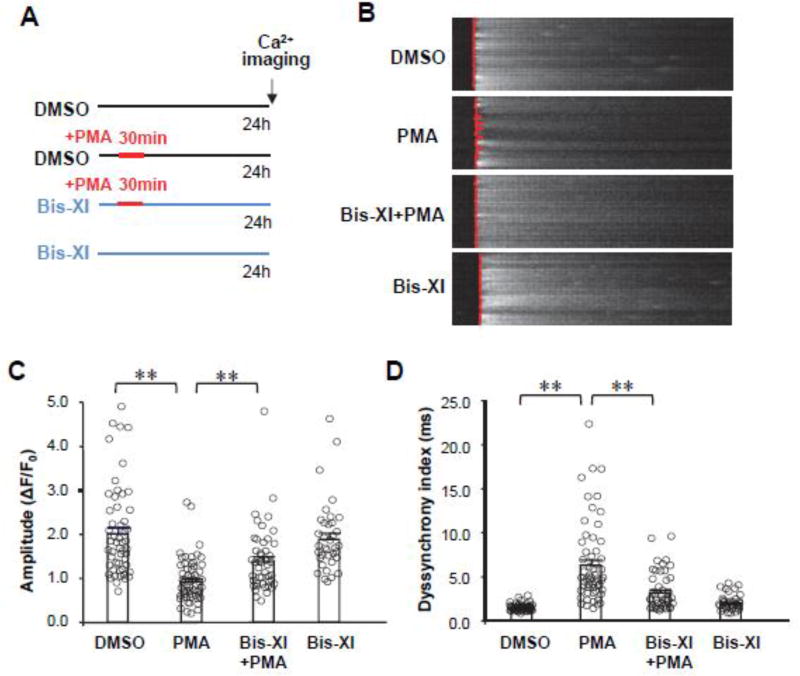
Figure 3. PKC activation disrupts Ca2+ handling properties in cardiomyocytes.
A, Schematic of experimental protocol. B, Representative cytosolic Ca2+ images under 1-Hz field in cultured cardiomyocytes after treatment as diagrammed in (A). The fluorescence intensity of Ca2+ imaging was normalized to baseline (F0). The red lines overlapping on Ca2+ images show the profile at the moment of Ca2+ transient firing on the scanning line in a point-by-point manner. A straighter line means better synchronization of the Ca2+ transients. C–D, Average data of the amplitude (C) and dyssynchronous index (D) of Ca2+ transients. n=53, 57, 46 and 36 cells, per group, respectively. ** p <0.01.

