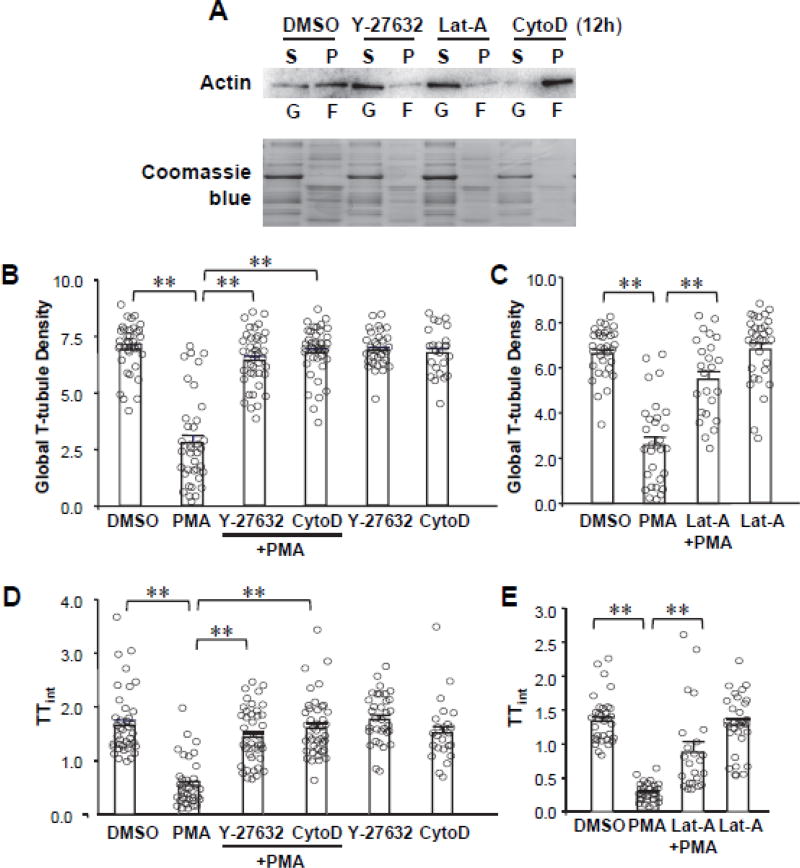
Figure 5. Effect of PKC activation on cytoskeletal dynamics.
A, Western blot of G- and F-actin in cytoskeletal fractions confirms the effect of Y-27632, Latrunculin-A (Lat-A) and Cytochalasin D (CytoD) on F-actin dynamics. B–E, Summary data of global T-tubule density (B, C) and index of T-tubule integrity (TTint, D, E) following transient PKC activation with PMA as in Figure 2A in the presence (continuously, for 24 hours) or absence of cytoskeletal disrupting agents (Lat-A and Y-27632) or stabilizing agent (CytoD). In B and D, n=39, 37, 41, 41, 33 and 24 cells per group, respectively. In C and E, n= 33, 30, 24 and 31 cells per group, respectively.

