
Fig. 2.
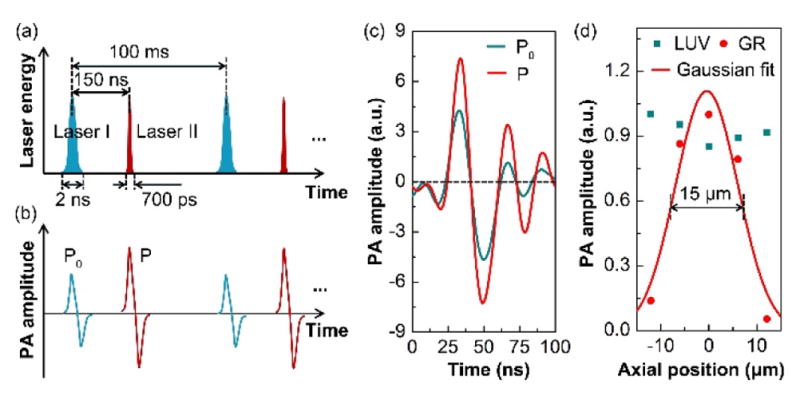
Study of the improved performance of the GRUV-PAM system. Schematics of (a) the laser pulse sequence and (b) the corresponding stimulated PA signals. The laser pair excites a mouse brain slice at a 10 kHz repetition rate. In each period, laser II is triggered 150 ns after laser I, which is well within the thermal relaxation time. (c) Experimentally measured PA A-line signal of a cell nucleus stimulated sequentially by laser I and laser II. The amplitude of P is greater than that of P0 due to the GR effect. (d) Experimentally measured PA amplitudes of a cell nucleus at different optical focal depths. The FWHM of the Gaussian fit is ~15 μm.