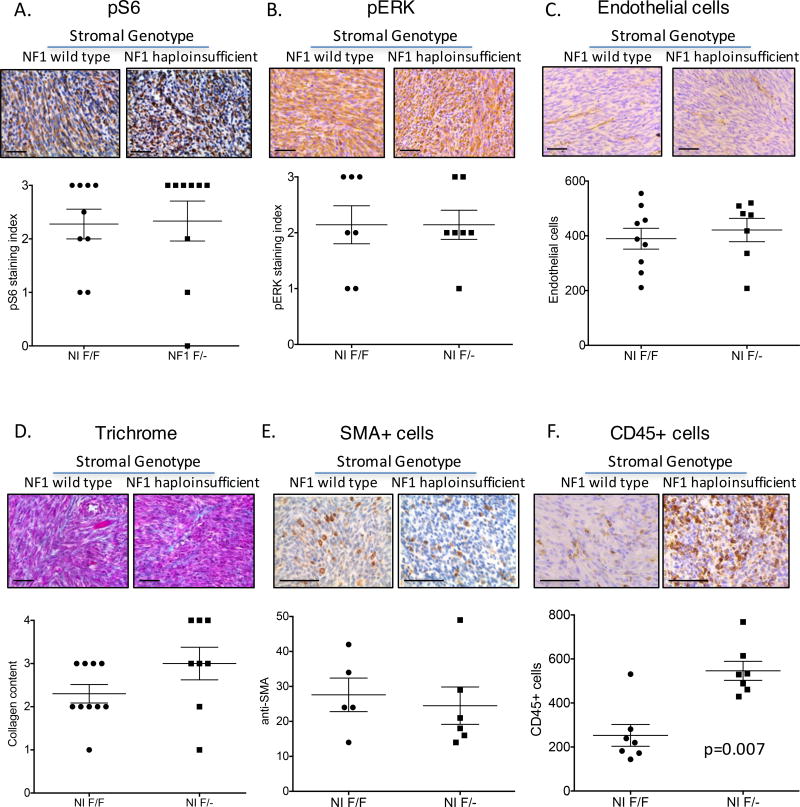
Figure 2. The Nf1 haploinsufficient microenvironment alters CD45+ immune cell infiltration into MPNSTs.
MPNSTs from NIF/F and NIF/− mice were examined for cell signaling molecules (A–B) and stromal cell components. No difference was found between the two genotypes of mice for pS6 levels (A), pERK levels (B), endothelial cell content measured by CD31+ (C), fibroblast activity, measured by collagen production via Masson’s Trichrome (D), or fibroblast number, measured by SMA staining (E). (F) CD45+ immune cells were enriched in MPNSTs in NIF/− mice. Each point represents a single tumor that was analyzed by 6 independent fields of slide. Scale bar is equal to 100 microns.

