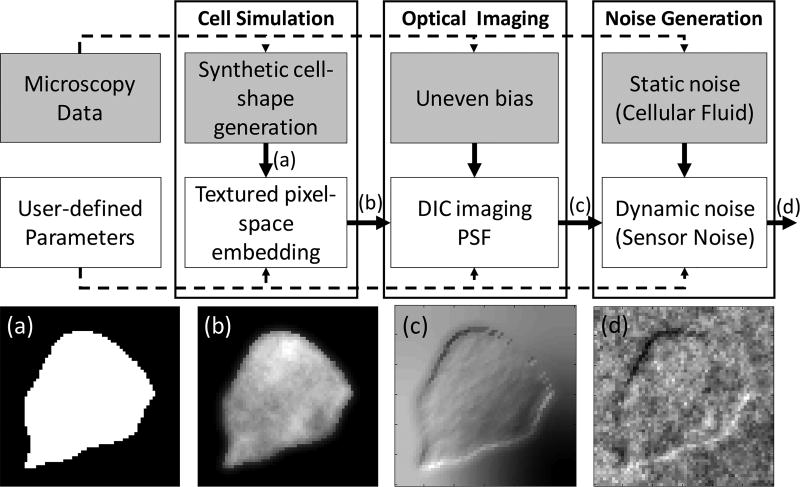
Fig. 7.
Block diagram of the cell simulator. Gray blocks: generative models that learn from available data. White blocks: generative models that rely on user-parameters. The respective images are outputs from the various stages of the simulator, including (a) Binary image of synthetic cell shape (b) Textured OPL image showing light transmission through tissue (c) Received image through DIC optics (d) Final image with noise and interference.

