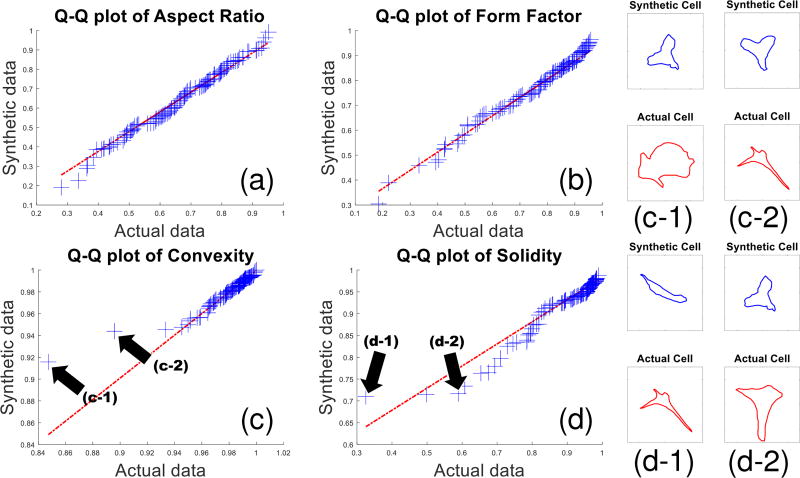
Fig. 8.
The quantile-quantile plots visualize similarities between the characteristics of simulated and actual cell-shapes. Distributions were compared for the following shape-features: (a) aspect ratio, (b) form factor, (c) convexity, and (d) solidity as defined in the text. (c-1,c-2,d-1,d-2) Several outlier pairs from the convexity and solidity plots are identified and shown. The outlier pairs appear to be caused by actual cell shape outlier statistics that are underrepresented (due to lack of training examples) and thus not fully captured by the model.

