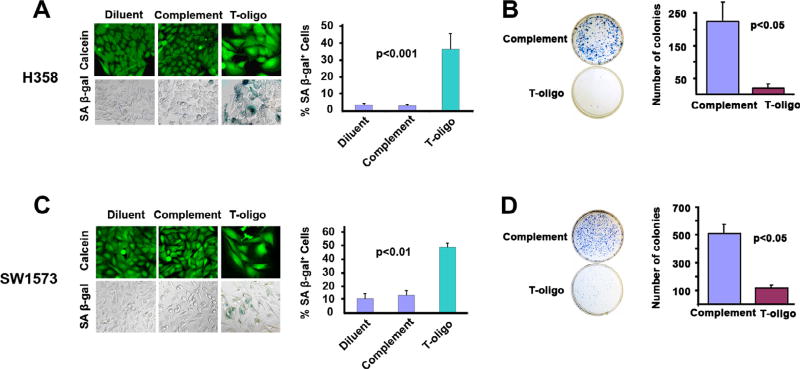
Fig. 3.
Exposure to T-oligo induces senescence in NSCLC cells. H358 and SW1573 cells were treated for one week with 40 µM of T-oligo, complementary oligo, or diluent and evaluated for a senescence-associated phenotype including morphology changes, positive staining for β-Galactosidase, and reduced clonogenicity. (A) H358 lung cancer cells treated for one week with T-oligo show a 12-fold increase in staining for senescence associated β-Galactosidase which appears as blue–green color. H358 cells treated with Toligo also exhibit a senescent morphology including an increased size similar to senescent fibroblasts as seen with Calcien AM staining. No senescence-associated changes were observed with complementary oligo or diluent controls. (B) Clonogenicity, a marker of senescence, was determined in H358 cells by treating cells for one week with complementary oligonucleotide or T-oligo and subsequently plating 2000 cells/well, culturing for eight days and then staining cells with 1% methylene blue in PBS. T-oligo decreased clonogenicity of H358 cells by 12-fold as compared to control. (C) SW1573 lung cancer cells treated with T-oligo for one week exhibited a 4-fold increase in positive staining for senescence associated β-Galactosidase, and on staining with Calcein AM, cells show an enlarged cell body. Minimal senescence associated changes were observed with complementary oligo or diluent controls. (D) Treatment of SW1573 cells with T-oligo reduced clonogenicity by 4-fold as compared to complementary oligonucleotide. (For interpretation of the references to colour in this figure legend, the reader is referred to the web version of this article.)

