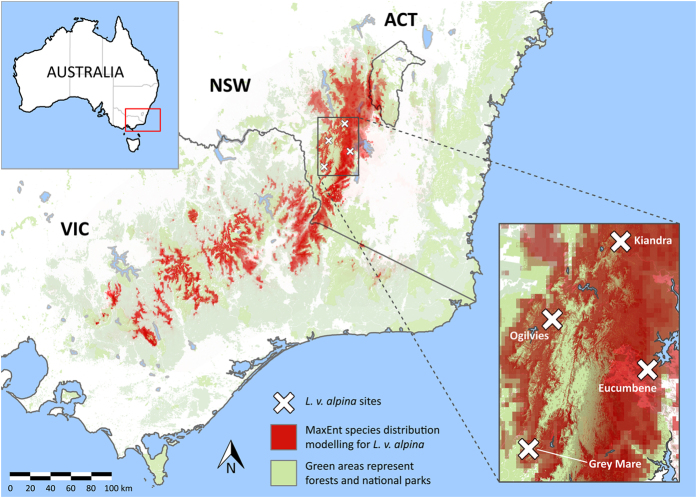
Figure 1. Map demonstrating location of the four source populations of L. v. alpina used in this study.
Inset shows greater detail. Red shading represents the predicted distribution range of L. v. alpina, using species distribution modelling algorithm MaxEnt and species presence data sourced from the Atlas of Living Australia (ALA) and filtered according to expert knowledge of subspecies distributions41–45. Green shading represents state forests and national parks. The effects of chytridiomycosis on the distribution of L. v. alpina have not been incorporated.

