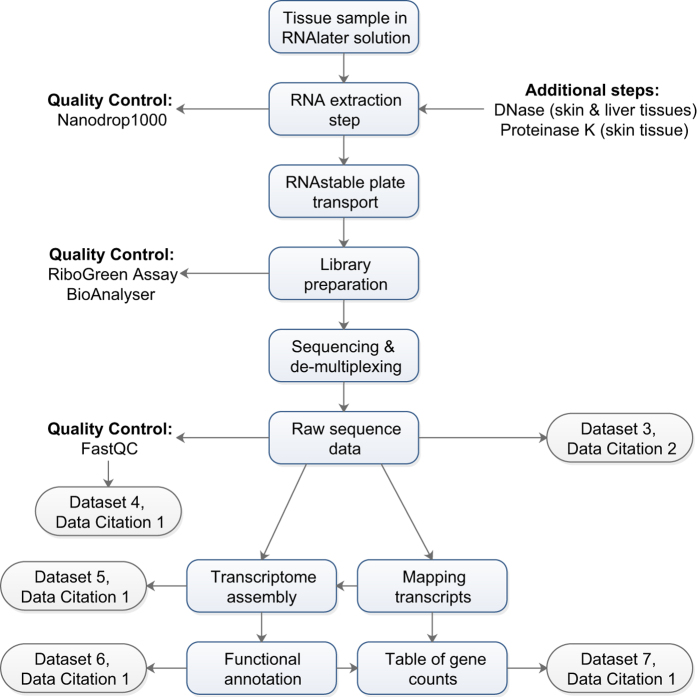
Figure 2. Schematic overview of the transcriptomic analyses performed in the study, and the corresponding quality control measures and data outputs.
Three tissues were collected from each frog (n=61) for transcriptomic analysis, yielding a total of n=181 samples (2 missing data). All tissue samples underwent RNA extraction, however skin and liver samples had their total RNA extracted with 5-Prime PerfectPure kit and were subject to a DNase step, skin samples were subject to a Proteinase K step, and spleen samples had their RNA extracted with Qiagen RNeasy minikit. All RNA samples were subject to quality control steps, library preparation and sequencing, producing raw sequence data for each sample. Tissue-specific transcriptomes were assembled de novo with Trinity34 and functionally annotated with BLAST2GO36 (with inbuilt quality control measures, including minimum e-value and percentage similarity), and henceforth all sample data were aligned and annotated based on these.

