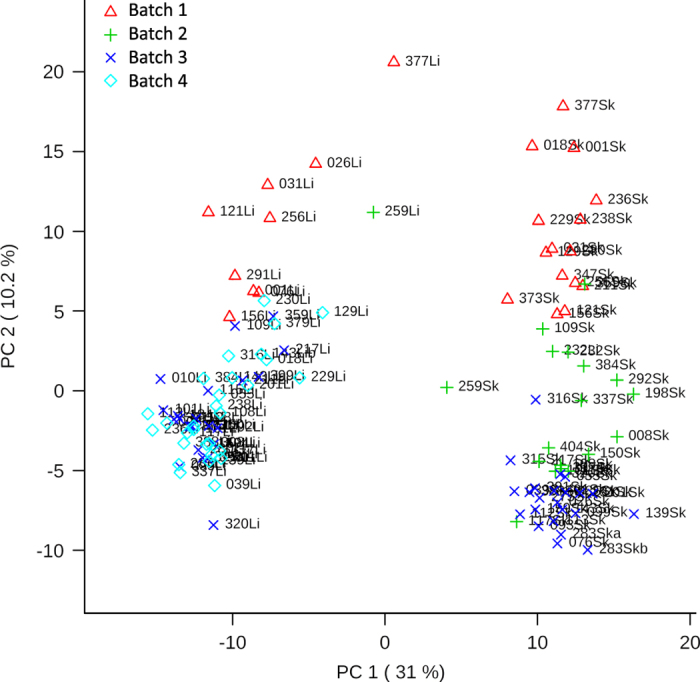
Figure 4. Principal components analysis scores plot for metabolite expression from both liver and skin tissue samples (L. Grogan unpublished data).

Expression data was first normalized by Total Area under Chromatogram by sample, and overall dataset log transformation and pareto scaling. Samples separate by tissue type on the horizontal axis (Principal Component 1, representing 31% of the variability) with liver samples on the left (‘Li’ in sample name) and skin samples on the right (‘Sk’ in sample name). Samples separate only mildly by batch (date of processing) on the vertical axis (Principal Component 2, representing 10.2% of the variability), consistent with preventative GC-MS maintenance regimens.
