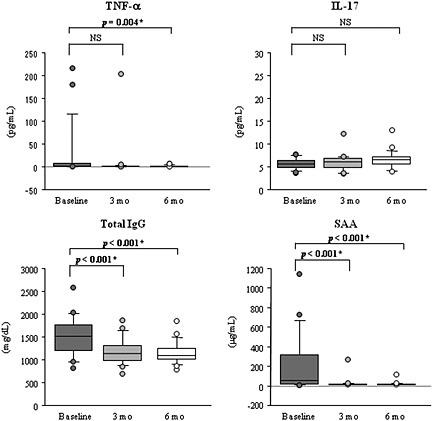
Figure 3.

Changes in serum levels of TNF‐α, IL‐17, total IgG, and SAA after TCZ therapy. The “*” denotes that p‐value marks significance of difference between baseline and reassessment (3 and 6 months), as assessed by Friedman and Wilcoxon signed rank tests (p < 0.017). TNF, tumor necrosis factor; IL‐17, interleukin‐17; IgG, immunoglobulin G; SAA, serum amyloid A; TCZ, tocilizumab; NS, no significant difference.
