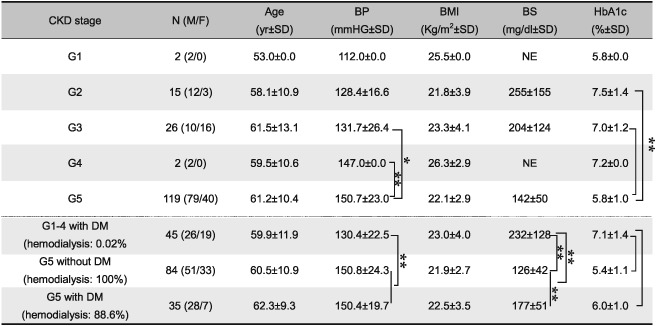
Table 2.
Comparison of each group categorized by CKD stage

Note: Stages of CKD were categorized by eGFR values in Japanese Society of Nephrology on 2012 (G1, ≥90; G2, 60–89; G3, 30–59, G4, 15–29; and G5, <15 ml min−1 1.73 m−2). Due to the small sample sizes, subjects with CKD stage 1, 2, 3, and 4 were combined into one group for comparative analyses. All of subjects in G1–4 group had contracted DM. CKD = chronic kidney disease; BP = systolic blood pressure; BMI = body mass index; BS = postprandial blood sugar level = HbA1c, hemoglobin A1c; DM = diabetes mellitus. NE = not examined; F = female; M = male; SD, standard deviation; eGFR = estimated glomerular filtration rate; ANOVA = analysis of variance; HSD, honestly significant difference
p < .05
p < .01, ANOVA with Tukey HSD test
