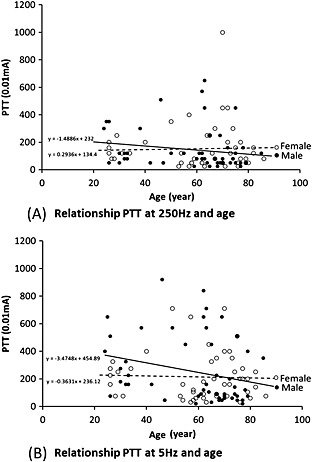
Figure 4.

Scatter charts with the regression line between pain tolerance threshold (PTT) and age. (A) At 250 Hz, no significant association between age, and PTT was found in men or women. (B) At 5 Hz, a significant association between age and PTT at 5 Hz was found in men but not in women.
