Figure 1.

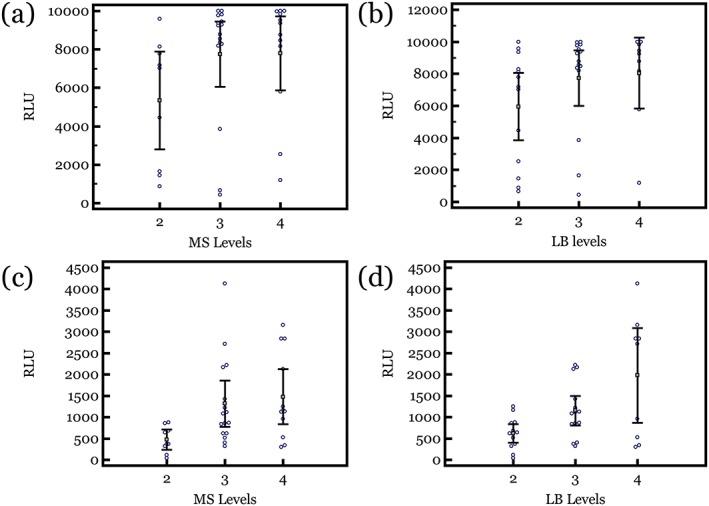
Relative value units (RLUs) of luminescence from each subject's samples were plotted against the corresponding Streptococcus mutans and Streptococcus sobrinus (MS) and lactobacillus (LB) bacterial ordinal scale levels that were determined through the CRT clinical‐based culture method. (a) Plaque t‐ATP RLU versus MS levels. (b) Plaque t‐ATP RLU versus LB levels. (c) Saliva i‐ATP RLU versus MS levels. (d) Saliva i‐ATP RLU versus LB levels. 95% confidence intervals of the means are shown. ATP = adenosine triphosphate
