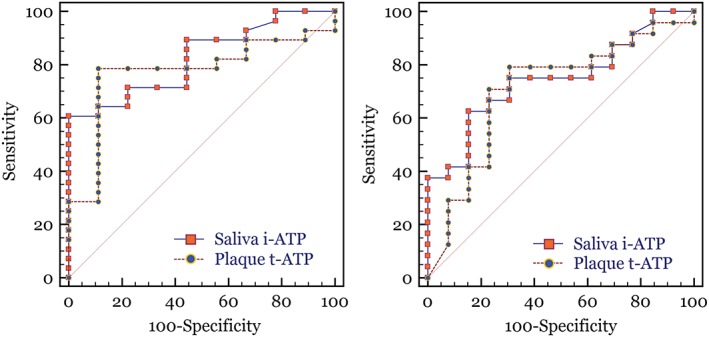
Figure 2.

Receiver operator characteristic (ROC) curves of plaque t‐ATP and saliva i‐ATP methods versus MS (left) and LB (right). ROC curves are created by plotting the sensitivity to the false positive rate (100‐specificity) at each relative light unit threshold value. Using the 0–2 to indicate low levels and 3–4 indicating higher levels of bacteria. The diagonal line across the ROC curve graphs represents a random 50%/50% test (a null hypothesis area of 0.5). LB = lactobacillus; MS = Streptococcus mutans and Streptococcus sobrinus
