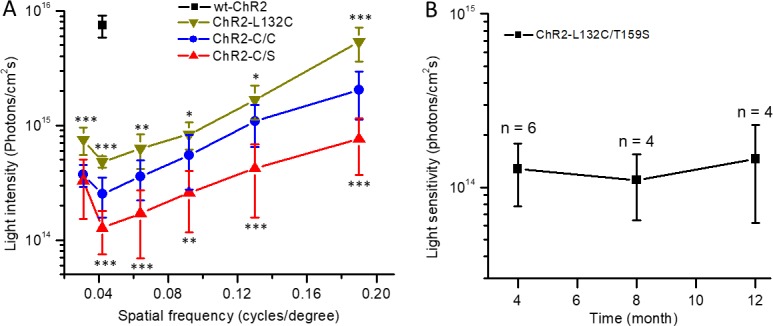
Figure 4.

Properties of OMR in TKO mice mediated by three ChR2 mutants and wt-ChR2. (A) Comparison of the relationship between the threshold light intensity and spatial frequency in ChR2-L132C– (n = 4 mice), ChR2-C/C– (n = 5), and ChR2-C/S–expressing mice (n = 6). The data point shown for wt-ChR2 is from the two (of four) mice that exhibited OMR. Data are expressed as the mean ± SD. *P < 0.05; **P < 0.01; ***P < 0.001. (B) The threshold light intensity required to elicit an OMR at 0.042 cycles per degree did not significantly change up to 1 year after virus injection (n = 4–6 mice).
