
Fig. 10.
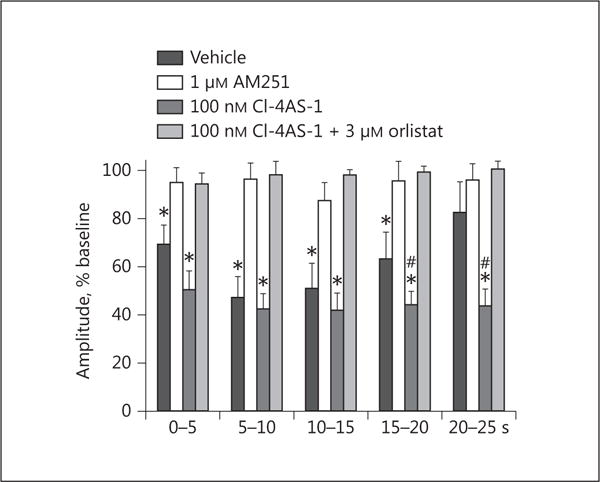
Composite bar graph corresponding to Figure 9 which illustrates that the time-dependent, DSE-induced reduction in eEPSC amplitude is blocked by AM251, enhanced by Cl-4AS-1, and abrogated by orlistat. Bars and vertical lines represent means and 1 SEM, respectively. * Values of post-stimulus eEPSC amplitudes observed during recordings from vehicle- or Cl-4AS-1-treated slices that are significantly different (p < 0.05; Kruskal-Wallis/median-notched box-and-whisker plot; n = 6–12) than those from slices treated with either AM251 or Cl-4AS-1 plus orlistat. # Values of post-stimulus eEPSC amplitudes observed during recordings from Cl-4AS-1-treated slices that were significantly different (p < 0.05; Kruskal-Wallis/median-notched box-and-whisker plot; n = 6–12) than those from vehicle-treated slices.