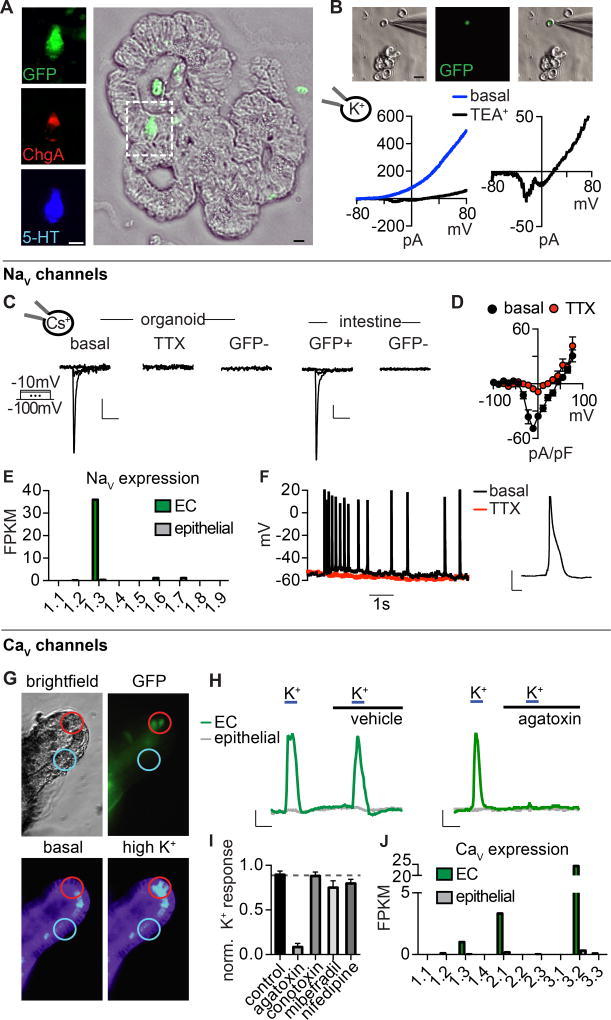
Figure 1. Enterochromaffin cells are electrically excitable.
A. Co-localization of chromogranin A-driven GFP reporter (ChgA-GFP, green), ChgA (red), and serotonin (5-HT, blue) labels enterochromaffin (EC) cells in intestinal organoids. Scale bar: 10µm.
B. Dissociated EC cell (green) in a representative patch-clamp experiment. Scale bar: 10µm. In response to a voltage ramp, the representative K+ current was blocked by 10 mM TEA+ to reveal a voltage-activated inward current. Representative of n=4 cells.
C. Voltage-gated currents in EC cells were inhibited by the NaV antagonist tetrodotoxin (TTX, 500nM). Scale bars: 50pA vertical, 10ms horizontal.
D. Average current-voltage relationship. n=7. p<0.0001 for basal versus TTX. Two-way ANOVA with post-hoc Bonferroni test.
E. mRNA expression profile of NaV pore-forming subunits in EC cells (green) compared with other intestinal epithelial cells (grey). Bars represent fragments per kilobase of exon per million fragments mapped (FPKM).
F. Spontaneous action potentials measured at resting membrane potential were inhibited by TTX. Representative of n=4. Inset: representative action potential, scale bar: 20mV, 10ms.
G. Representative calcium (Ca2+) imaging experiment from EC cells (GFP, green) in an intestinal organoid. High extracellular K+ increased cytosolic Ca2+, indicated by a change in fluorescence ratio of Fura-2AM.
H. Ca2+ responses to K+-elicited depolarization in EC (green) or neighboring cells (grey). The P/Q-type CaV inhibitor ω-agatoxin IVA abolished responses. Scale bar: 0.25 Fura-2 ratio, 50s.
I. Pharmacological profile of CaV-mediated responses. n=6 per condition. Data represented as mean ± sem. p<0.0001 for control versus 300nM ω-agatoxin IVA. One-way ANOVA with post-hoc Bonferroni test. All data represented as mean ± sem.
J. mRNA expression profile of CaV pore-forming subunits in EC cells (green) compared with other intestinal epithelial cells (grey).

